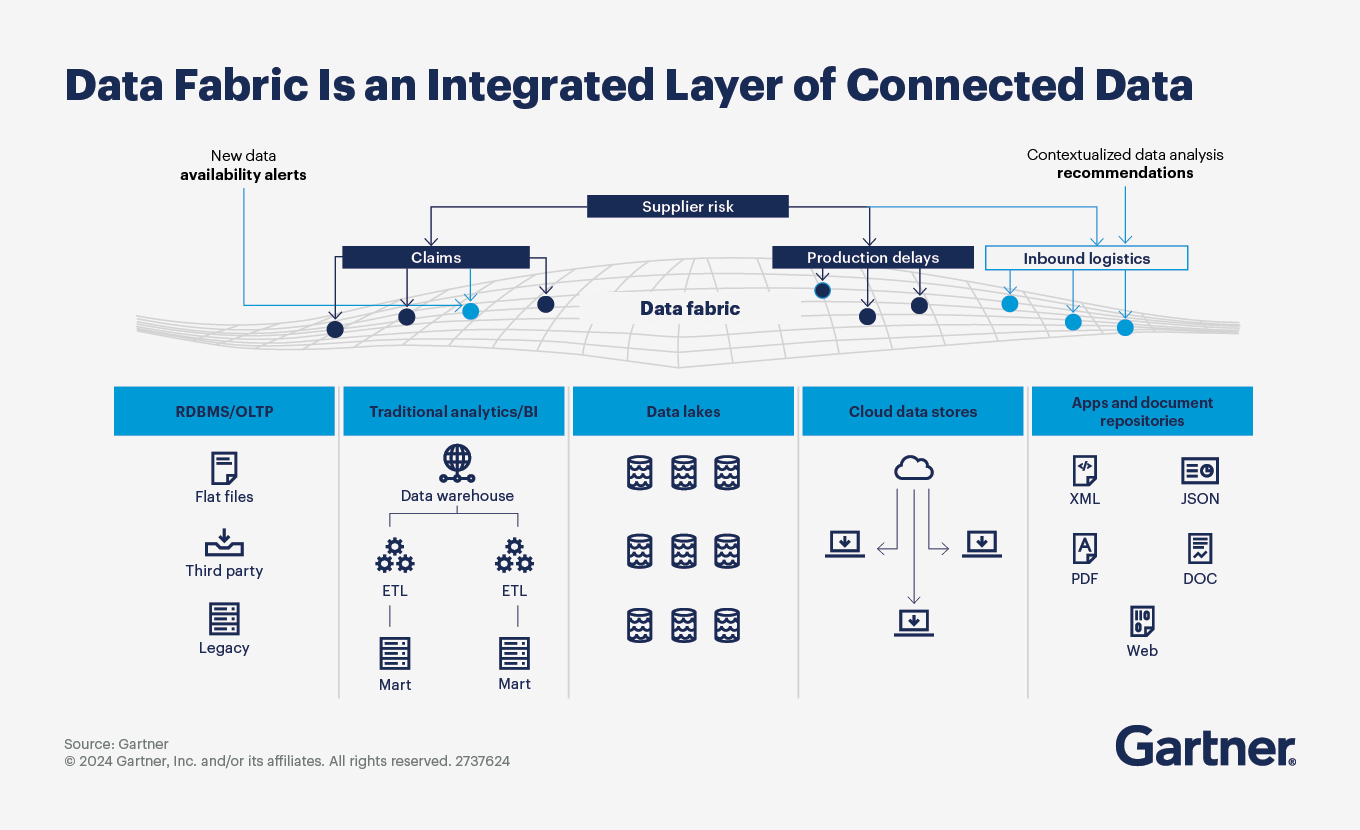
Data fabric is a unified layer that seamlessly connects diverse data sources, including relational databases, data warehouses, data lakes, cloud stores, and apps. By integrating these systems, a data fabric simplifies data access, management, and analysis across an organization.
Data fabric enables real-time alerts and contextual analysis by linking data from areas like claims, supplier risk, and logistics. This integration helps businesses gain comprehensive insights, automate data connections, and make informed decisions more efficiently. In this article, we will dive into the details of data fabric. Let’s get started!.
Table of Contents
What is Data Fabric?
A data fabric is like an intelligent network that connects all of a company’s data, making it easier to access, integrate, and use. Imagine you have data spread out in different places—on your computer, in the cloud, in various apps, and maybe even from external sources. A data fabric ties all of this data together, creating a flexible system that allows anyone in the organization to find and use the data they need, whenever they need it.
But it’s more than just a way to organize data. A data fabric uses smart technologies like artificial intelligence (AI) to automate some of the heavy lifting, such as cleaning up data or combining different sources into a single, easy-to-understand format. This way, teams don’t have to waste time manually gathering and preparing data—they can focus on using it to make decisions and solve problems.
The Benefits of Data Fabric
Data fabric is useful for many organizations because it works with their existing tools and systems. Instead of needing to replace everything (like data warehouses or data lakes), data fabric can be added on top of what’s already in place. This means businesses don’t have to throw away their old investments. Instead, data fabric helps them make the most of what they already have by making data integration easier, or even fully automated in some cases.
Though data fabric is still new and no single vendor provides all the pieces, it offers many potential benefits:
Easy Access to Data
It allows non-technical users, like business teams, to quickly find, combine, analyze, and share data without needing help from IT. This speeds up decision-making and boosts productivity.
Automated Data Management
Data fabric can automate many of the manual tasks involved in accessing and integrating data. This means data engineers can respond to requests faster, improving agility and reducing delays.
Faster Insights
By making data easier to access and analyze, data fabric helps organizations get insights from their data faster. This is crucial for staying competitive and making informed business decisions.
Cost Efficiency
With better use of existing data and improved data design and delivery, businesses can reduce costs by avoiding waste and making smarter use of their data resources.
How to Build a Data Fabric
Building a data fabric is about creating a system that makes it easier for everyone in an organization to find, manage, and use data. Think of it as setting up a smart network that connects all the different pieces of data your business has, so they can work together smoothly. Here’s a simple, step-by-step look at how to build one and what each part involves.
1. Set Up a Data Catalog
The first step in building a data fabric is setting up a data catalog, which acts like a library for all your data. Imagine it as a central place that organizes information about your data—called metadata—from different sources. To get started, you’ll need to connect this catalog to all the places where your data is stored, whether it’s in databases, cloud storage, software applications, or even external systems.
By using AI and machine learning (ML), the catalog can automatically find, scan, and organize data, keeping everything up to date as new data comes in. It gathers details like what type of data it is, where it’s located, who owns it, and how it’s used, making it much easier for anyone in your organization to search for and understand the data they need.
For example, a company might have sales figures in a cloud database, customer details in a CRM system, and inventory records on local servers. The data catalog will bring all this information together in one place, so teams can quickly see what data is available and where to find it.
Popular tools for creating a data catalog include Informatica Enterprise Data Catalog, Microsoft Azure Data Catalog, AWS Glue Data Catalog, Google Cloud Data Catalog, Apache Atlas, and Talend Data Catalog.
2. Perform Graph Analytics on Metadata
Once you’ve set up your data catalog, the next step is to dive into graph analytics on the metadata. Think of graph analytics as a powerful tool that helps you map out and visualize the relationships between different pieces of data, making it easier to see how they interact with one another. By analyzing your metadata in this way, you can uncover patterns and connections, such as which datasets often work together or share similar characteristics.
This process is crucial for understanding the flow of data throughout your organization. It can reveal hidden connections and relationships that you might not notice at first glance. For instance, graph analytics could show you that customer order data is closely tied to product review data, offering insights into how sales and customer feedback are interconnected. This kind of understanding can guide your business decisions and strategies.
3. Train AI/ML Models to Automate Data Tasks
After uncovering connections between data points through graph analytics, the next step is to use these insights to train AI and machine learning (ML) models that can automate various data tasks. This analysis helps the models learn to perform functions like integrating data sources, cleaning data, and making connections on their own.
For instance, instead of requiring a data engineer to manually link marketing and sales data, AI can automatically identify patterns and merge the information from both departments. This automation not only speeds up processes but also ensures consistency and accuracy in data integration and management. By letting AI handle routine tasks, your team can focus on more strategic initiatives, leading to greater efficiency and improved decision-making.
4. Create Knowledge Graphs
Once you have the AI models in place, the next step is to create knowledge graphs. These graphs visually represent how data is connected across different parts of your business, giving you a clearer understanding of your data landscape.
To build these knowledge graphs, you’ll use your data catalog and the insights gained from graph analytics to map out the relationships between various datasets. Knowledge graphs make it easy for teams to spot important connections, like data shared between departments or dependencies between different datasets, which enhances data integration and analysis.
For example, a knowledge graph might show how product data links to inventory records, sales figures, and customer feedback. This provides teams with a comprehensive view of product performance from multiple angles, helping them make better-informed decisions.
5. Add Semantics to Knowledge Graphs
You can enhance the effectiveness of knowledge graphs by adding semantics, which gives the data deeper business meaning. This allows the system to understand not just that data points are connected, but what those connections signify in a business context.
To do this, define key business terms and concepts so that the data fabric can recognize important identifiers—like “customer ID” or “product category”—across various systems. Standardizing these terms helps eliminate confusion and improve data quality. For example, if one system uses “cust_ID” and another uses “client_no” for the same entity, adding semantics ensures the data fabric understands these terms refer to the same information.
This semantic layer makes the data fabric smarter, resulting in better insights and improved functionality for analytics and AI models, ultimately enabling your organization to make more informed decisions based on reliable data.
6. Automate Data Integration and Management
The final step is to let the AI and ML engines within the data fabric take over and automate many data tasks. This shift makes data management faster, more efficient, and less reliant on manual effort. The level of automation typically progresses through three stages: engagement, insights, and automation.
In the engagement phase, the system simplifies data access for non-technical users, allowing them to find information quickly using straightforward tools like semantic search. For example, a salesperson can easily locate customer data by typing in simple keywords rather than complex queries.
The insights stage automates processes such as tagging data, detecting unusual patterns, and highlighting critical information, like data that needs to comply with privacy regulations.
Finally, in the automation stage, the system can resolve issues independently. For instance, if a new data source is added, the data fabric can automatically integrate it, tag the new data, and suggest how to combine it with existing information, all without human intervention.
Data Fabric vs. Data Mesh
The terms “data fabric” and “data mesh” are sometimes mistaken for the same thing or viewed as competing strategies. However, they are actually distinct concepts. In the right situations, they can even work together to enhance each other’s strengths.
Data Fabric is a modern approach to data management that focuses on automating data tasks using metadata. Think of it as a smart system that helps organizations integrate, manage, and access their data more efficiently. By using metadata, it can streamline how data is organized and utilized across different platforms, making it easier for teams to find and use the data they need without relying heavily on manual processes.
On the other hand, Data Mesh is an architectural framework that prioritizes the creation of data products tailored to specific business needs. It promotes a decentralized approach, allowing different teams within an organization to take ownership of their data. This means that instead of having a central team manage all the data, various teams can develop their data solutions based on their unique requirements. Data mesh emphasizes collaboration and encourages teams to leverage their expertise to build data products that align closely with business objectives.
While both data fabric and data mesh aim to improve access to and use of data, they do so in different ways. Data fabric focuses on efficient management and automation, whereas data mesh empowers teams to create context-driven solutions that cater to their specific business challenges.